KB Article #6636
DeliverNow Reporting allows you to view, sort, and drill into your on-demand delivery information--allowing you to analyze your on-demand delivery experience and the benefits of this solution.
Reporting is divided into six sections, helping you better analyze and interpret the available data.
Click the links below for more information:
- To view DeliverNow reporting...
- Viewing a specific report:
- Snapshot: Dashboard displaying a wide variety of key program metrics
- Detail: Table of individual experiences detail that you can sort and report.
- Aggregate: Metrics featured in Snapshot, aggregate, and more, all on one exportable table.
- Monthly: Key metrics by month in both a chart and an exportable table.
- Insight: Informative visualization beyond time series. New content will be added as it's identified.
- Survey: Survey results by total survey and by survey question.
- Map: Geographical maps showing various experience details.
Note: DeliverNow reports are updated nightly. Any transactions you complete in a day will not be reflected in your dashboard until the next morning.
- From the DeliverNow tab, click Reporting.

- By default, TRANSPORTATION will be the selected report.

- If needed, the date range can be edited by using the drop-downs and text box.

- Select Last, Next, or This.
- Type in a number.
- Select the desired measurement.

- Days
- Weeks
- Weeks (Calendar)
- Months
- Months (Calendar)
- Years
- Years (Calendar)
- Date range changes will not apply to all tabs and will need to be adjusted on each tab to display a specific timeframe.
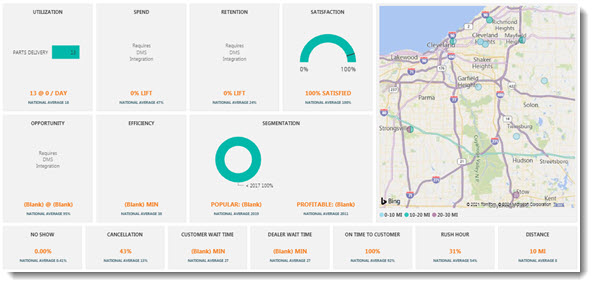
Snapshot
- By default, the SNAPSHOT tab will be displayed first when accessing Reporting.

- DeliverNow will display metrics you most care about in easy-to-read tiles. DeliverNow is integrated with the Utilization and Satisfaction tiles:
- UTILIZATION: Total experience count and average per day. The chart shows a count of completed bookings.
- SATISFACTION: Average survey score. The chart shows average survey score vs 90% target.
Detail
- At the bottom of the Reporting window, click the DETAIL tab.
- All on-demand delivery trips will display.
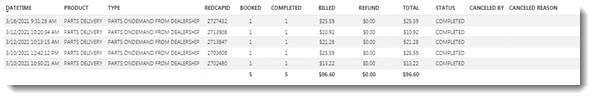
The trip details include:-
- DEALER: Dealer name.
- DATETIME: Date and time the experience began.
- PRODUCT: Redcap Product.
- TYPE: Experience type.
- REDCAPID: Experience ID to reference when contacting client support.
- BOOKED: Count of experiences booked.
- COMPLETED: Count of experiences completed.
- BILLED: Redcap experience charges billed.
- REFUND: Redcap experience charges refunded.
- TOTAL: Redcap experience charges total.
- STATUS: Experience status.
- CANCELED BY: User that cancelled an experience.
- CANCELED REASON: Reason why an experience was cancelled.
- BOOKER: User that booked the experience.
- PARTNER: Dealership employee linked to the experience.
- MINUTES: Duration of experience from start to finish in minutes.
- MILES ESTIMATE: Estimated driving distance from dealer to customer.
- RO NUMBER: RO number connected to experience via the DMS or data entry.
- REF NUMBER: Client provided reference number (e.g. ad-hoc or RepairLink transaction ID).
- CUSTOMER: Customer name.
- VIN: Customer VIN.
- YEAR: Customer vehicle year.
- MAKE: Customer vehicle make.
- MODEL: Customer vehicle model.
- CITY: Experience customer location city.
- STATE: Experience customer location state.
- ZIP: Experience customer location zip.
- CUSTOMER SPEND: (Not currently available) RO customer spend received from the DMS through integration.
- INTERNAL SPEND: (Not currently available) RO internal spend received from the DMS through integration.
- WARRANTY SPEND: (Not currently available) RO warranty spend received from the DMS through integration.
- TOTAL SPEND: (Not currently available) RO total spend received from the DMS through integration.
-
- Detail results can be further analyzed by filtering with one or more of the options at the top:

-
- TYPE: Experience type.
- STATUS: Experience status.
- SOURCE: Booking source.
- REDCAPID: Experience to reference when contacting client support.
- RO: RO number connected to experience via the DMS or data entry.
- CUSTOMER: Customer name.
- VIN: Customer VIN number.
-
Notes:
- Click the Focus mode (
 ) button to enlarge the information. (Click Back to Report to redisplay the condensed information.)
 - Click the More options (
 ) button to:
- Change the sort option for a graph.
- Export (Export data) the summarized (data that displays in the graph).
Aggregate
- At the bottom of the Reporting window, click the AGGREGATE tab.
- Aggregate results will display:

Columns include:
-
- COMPLETED: Count of completed experiences.
- BOOKED: Count of total booked experiences (completed and cancelled).
- CANCELED: Count of cancelled experiences.
- CANCEL %: Percent of booked trips that were cancelled.
- RO COUNT EXP: Count of ROs with an experience (must have DMS integration--not currently available).
- RO COUNT NOEXP: Count of ROs without an experience (must have DMS integration--not currently available).
- TOT RO% UPLIFT: Percent change in average total RO value when using Redcap (must have DMS integration--not currently available).
- TOT RO$ UPLIFT: Dollar change in average total RO value when using Redcap (must have DMS integration--not currently available).
- CUST RO% UPLIFT: Percent change in average customer pay RO value when using Redcap (must have DMS integration--not currently available).
- CUST RO$ UPLIFT: Dollar change in average customer pay RO value when using Redcap (must have DMS integration--not currently available).
- WARR RO% UPLIFT: Percent change in average warranty pay RO value when using Redcap (must have DMS integration--not currently available).
- WARR RO$ UPLIFT: Dollar change in average warranty pay RO value when using Redcap (must have DMS integration--not currently available).
- OPP % NON RC MISSED: (not currently available) Percent of ROs closed without an experience.
- OPP $ NON RC MISSED: (not currently available) Sum of uplift missed for ROs closed without an experience.
- CUST SURVEY RESP: Count of survey responses.
- CUST SURVEY SCORE: Average survey response score.
- RIDE COST: Cost for Redcap completed rides or parts deliveries.
- RIDE COST PER EXP: Average cost per Redcap completed rides or parts deliveries.
-
- Aggregate results can be further analyzed by selecting one of the options at the top:

-
- DEALER: Dealer name.
- PROGRAM: Program.
- GEO1: Customer region, market zone, group, etc. #1.
- GEO2: Customer region, market zone, group, etc. #2.
- PRODUCT: Products available.
- SOURCE: Booking source.
- BOOKER: User that booked the experience.
- PARTNER: Dealership employee linked to the experience.
-
Notes:
- Click the Focus mode () button to enlarge the information
 . (Click Back to Report to redisplay the condensed information.)
 - Click the More options () button to:
- Change the sort option for a graph.
- Export (Export data) the summarized (data that displays in the graph).
Monthly
- At the bottom of the Reporting window, click the MONTHLY tab.
- Monthly results will display a chart and table based on the Metrics being used to filter data.

- Use the Metrics to change the displayed graph and table.

-
- COMPLETED: Count of experiences completed by product by month.
- BOOKING STATS: Count of experience booked vs completed vs cancelled by month.
- TOTAL SPEND: Average total RO spend when using Redcap vs without and the difference by month. Line shows the percent change (must have DMS integration--not currently available).
- CUST SPEND: Average RO customer spend when using Redcap vs without and the difference by month. Line shows the percent change (must have DMS integration--not currently available).
- WARR SPEND: Average warranty spend and the count of those ROs using Redcap vs without, the difference, and the percent change by month (must have DMS integration--not currently available).
- SURVEY SCORES: Average surgery responses scores by product by month.
-
- Monthly results can be further analyzed by using the filters at the top:

-
-
-
- DEALER: Dealer name.
- PROGRAM: Program.
- GEO1: Customer region, market zone, group, etc. #1.
- GEO2: Customer region, market zone, group, etc. #2.
- PRODUCT: Products available.
- SOURCE: Booking source.
- BOOKER: User that booked the experience.
- PARTNER: Dealership employee linked to the experience.
-
-
-
Notes:
- Click the Focus mode () button to enlarge the information. (Click Back to Report to redisplay the condensed information.)
- Click the More options () button to:
- Change the sort option for a graph.
- Export (Export data) the summarized (data that displays in the graph).
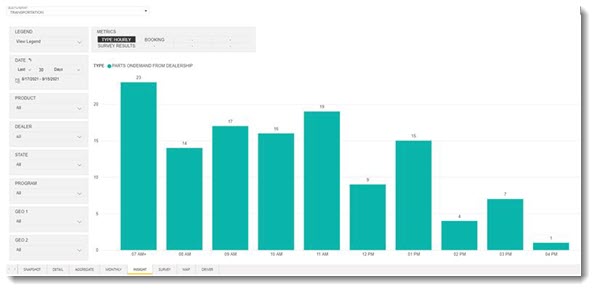
Insight
- At the bottom of the Reporting window, click the INSIGHT tab.
- Results on this page will display informative visualization beyond the time series found in the Monthly reporting. New content will be added as it's identified.

- Use the Metrics to change the displayed graph.

- TYPE HOURLY: Count of experiences by hour started for each product.
- BOOKING HOURLY: Count of experiences booked vs completes vs cancelled by hour started.
- SURVEY RESULTS: Survey responses results for each question.
Survey
- At the bottom of the Reporting window, click the SURVEY tab.
- Your customer survey responses will display.
- A summary of the on-demand delivery survey details from your customer will display at the top.
Data will include:- REDCAPID: Experience ID to reference when contacting client support.
- EXPERIENCE DATE: Date experience completed.
- CUSTOMER: Customer name.
- VIN: Customer VIN number.
- PRODUCT: RedCap Product
- TRIP TYPE: Experience type.
- DEALER: Dealer name.
- SURVEY SCORE: Total score for the survey equal to average of all scoreable questions.
- Highlight an on-demand delivery and individual survey results will display at the bottom.
The survey results include:-
- REDCAPID: Experience ID to reference when contacting client support.
- EXPERIENCE DATE: Date experience completed.
- CUSTOMER: Customer name.
- VIN: Customer VIN number.
- QUESTION: Survey question.
- RESPONSE: Response received.
- RESPONSE SCORE: Survey response score for each question.
-
- Survey results can be further analyzed by filtering with one or more of the options at the top:

-
- SURVEY: Survey type customer or driver.
- TYPE: Status.
- REDCAPID: Experience to reference when contacting client support.
- CUSTOMER: Customer name.
- VIN: Customer VIN number.
- RESPONSE: Text responses for searching by keyword.
-
Notes:
- Click the Focus mode () button to enlarge the information. (Click Back to Report to redisplay the condensed information.)
- Click the More options (
 ) button to:
- Change the sort option for a graph.
- Export (Export data) the summarized (data that displays in the graph).
Map
- At the bottom of the Reporting window, click the MAP tab.

- The map can display by HEATMAP or DISTANCE.

- Selecting DISTANCE will display a map indicating trip distance from your dealership. Use the key to determine mileage.

- Hover over a dot to view individual trip details.

The following details will display:-
- CustomerTripDistanceEstimateGroup: Categorized by distance from dealer (e.g. 10-20 miles, 20-30 miles, etc.).
- Trip Lat: Customer latitude.
- Trip Lng: Customer longitude.
- Dealer: Dealer name.
- Address: Customer address.
- City: Customer city.
- State: Customer state.
- Zip: Customer zip.
- Distance Estimate:
- Distance Surface:
-
- Clicking on the dot will filter results on the right and display:
-
- CUSTOMER NAME: Customer name.
- MILES ESTIMATE: Estimated driving distance from dealer to customer.
- RO NUMBER: RO number connected to experience via the DMS or data entry.
- CUSTOMER VIN: Customer VIN.
- REDCAPID: Experience ID to reference when contacting client support.
-
- Hover over a dot to view individual trip details.
- Selecting HEATMAP will display the following:

- Results on the right will display:
- CITY: Customer city.
- STATE: Customer state.
- ZIP: Customer zip.
- COMPLETED:
- DEALER: Dealer name.
- Results on the right will display:
- Map results can be further analyzed by filtering with one or more of the options at the top:

-
- TYPE: Experience type.
- SOURCE: Booking source.
- REDCAPID: Experience to reference when contacting client support.
- RO: RO number connected to experience via the DMS or data entry.
- VIN: Customer VIN number.
-
Notes:
- Click the Focus mode () button to enlarge the information. (Click Back to Report to redisplay the condensed information.)
- Click the More options () button to:
- Change the sort option for a graph.
- Export (Export data) the summarized (data that displays in the graph).