KB Article #4112
In an effort to provide you with data that matters most, LinkIQ features Metrics--a performance dashboard available to all users. The dashboard will display valuable and achievable performance information for the following OEC solutions.
Click the links below for more information on the data displayed in each graph:
Notes:
- If you subscribe to LinkIQ, Metrics will be available from your LinkIQ tab. If you do not, the dashboard can be found in the Metrics tab. (CollisionLink and RepairLink are only available to LinkIQ subscribers.)
- LinkIQ reports are refreshed daily each morning. Any transactions you complete in a day will not be reflected in your dashboard until the next morning.
To view a specific dashboard:
- Information is displayed by OEM. If your dealership services multiple manufacturers, use the Select Manufacturer drop-down to switch.
- Use the Select Solution drop-down to view data for a specific OEC solution.
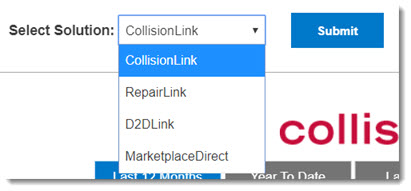
- Click Submit to display the reports.
- To change the timeframe for a report, click your preferred option. The following time frames can be selected: (Not all reports are available for all time frames.)
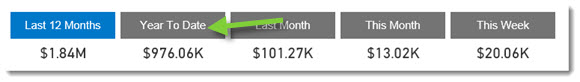
- Last 12 Months: All data for the previous 12 months. (This option will display by default.)
- Year To Date: All data for the current calendar year.
- Last Month: Data for the previous calendar month.
- This Month: Data for the current calendar month.
- This Week: Data for the current week. (Sunday to Saturday)
Notes:
- Information on the Metrics dashboards is updated nightly.
- Click the Focus mode (
 ) button to enlarge a specific graph. (Click Back to Report to redisplay all graphs.)
 - Click the More options (
 ) button to:
- Change the sort option for a graph.
- Export (Export data) the summarized (data that displays in the graph) or underlying data into Excel or CSV format. (Underlying data can only be exported in Excel format.)
- View the data breakdown ( See Data ) for the graph.
CollisionLink
Order Volume Mix: The dollar total of all transactions (by original part type) submitted to the dealer using CollisionLink.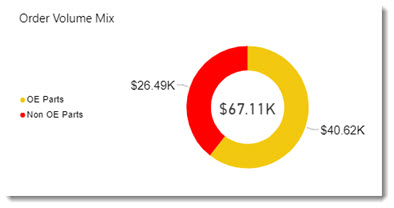
|
Field Name |
Definition |
|
OE Parts |
Parts that were specified "OE" on CollisionLink transactions. |
|
Non OE Parts |
Parts that were specified as any "Non-OE" part type on CollisionLink transactions, including aftermarket, salvage, and other. |
Sales Trend: The dollar total of all Invoiced/Completed part sales through CollisionLink.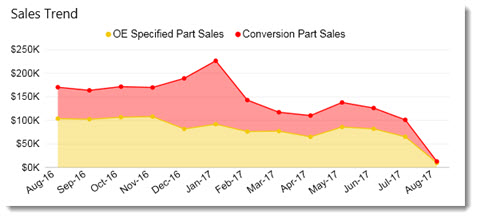
Move your mouse over the graph to view your total sales and total reimbursements for a specific timeframe.
|
Field Name |
Definition |
|
OE Specified Part Sales |
Parts that were sent to your dealership on the CollisionLink transaction as OE parts and were invoiced/completed as OE parts. |
|
Conversion Part Sales |
Parts that were sent to your dealership as Non OE (AM, Salvage, Other) on the CollisionLink transaction but were converted/invoiced as OE sales. |
Order Mix: Total number of CollisionLink transactions sent to your dealership, separated by source.
|
Field Name |
Definition |
|
CollisionLink |
Transactions sent to your dealership using CollisionLink or its estimating system integration. |
|
PartsTrader |
Transactions sent to your dealership through PartsTrader. |
Year to Date Shop Usage: Allows you to track area shop usage and opportunities for the current year. Click here to learn how to use this report to increase business! 
|
Field Name |
Definition |
|
Area CollisionLink Shops |
Total number of shops within 50 miles of your dealership that are either attached to your dealership as a Trading Partner or not attached to any dealership (including yours) that services the same manufacturer. |
|
Attached Shops |
Shops that have an active/enabled Trading Partner attachment to your dealership. |
|
Transacting Shops |
Shops that have sent an order to your dealership this year. (The percentage rate shown represents your transacting shops compared to the total number of shops in your area using CollisionLink.) |
Estimate Uploader
CL Transactions vs Estimates: A comparison of all CollisionLink transactions and all estimates that took place during the last month. 
Top 5 Shops by CL TransactionCount: Allows you to track your top 5 shops, determined by the number of CollisionLink transactions placed.
Shop Performance (only includes shops where you are the preferred dealer): A breakdown of the shops that currently list your dealership as their preferred location. 
RepairLink
Carts Started: The trend of total carts started by customers shopping from your dealership.
Shop Activity Summary: An overview of how your customers are using RepairLink Shop.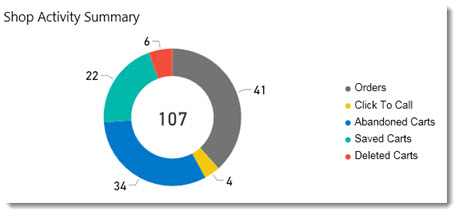
|
Field Name |
Definition |
|
Orders |
The total number of orders placed to your dealership. |
|
Click to Call |
The number of times a user selected the Click to Call button within RepairLink Shop while shopping from your dealership. |
|
Abandoned Carts |
The number of times a RepairLink Shop user created a cart but did not do one of the following: complete the order, save the cart, or delete the cart. |
|
Saved Carts |
The number of times a RepairLink Shop user saved a cart while shopping from your dealership. |
|
Deleted Carts |
The number of times a RepairLink Shop user deleted a cart while shopping from your dealership. |
Year to Date Shop Usage: Allows you to track area shop usage and opportunities for the current year. Click here to learn how to use this report to increase business!
|
Field Name |
Definition |
|
Attached Shops |
Shops that have an active/enabled Trading Partner relationship with your dealership. |
|
Active Shops |
Customers that used RepairLink Shop (in any way) this year. |
|
Starting Carts |
Customers that have added parts to a cart in RepairLink Shop this year. |
|
Placing Orders |
Customers that have sent orders to your dealership (using RepairLink) this year. (The percentage shown represents the number of shops placing orders compared to the total number of shops attached to your dealership.) |
Sales Trend: Allows you to view the dollar total of all invoiced/completed parts sales through RepairLink.
|
Field Name |
Definition |
|
Non-Program Parts Sales |
Dollar amount of parts sold for parts that were not part of a manufacturer program on RepairLink. |
|
Program Parts Sales |
Dollar amount of parts sold for parts that were a part of a manufacturer program on RepairLink. |
D2DLink
Average Parts Available on Locator: The average number of parts your dealership has available for sale on the Locator. Note: This number does not include any parts added to an exclusion rule.
Total Locates Performed: The total number of times you have searched for parts using the D2DLink Locator.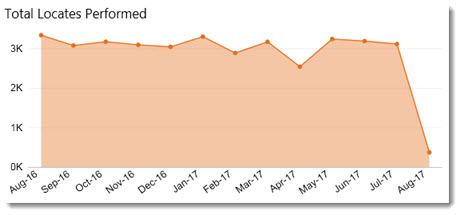
Number of Parts Showing in Locates: The total number of parts (not unique) from your dealership that have appeared in other dealer's Locator search results.
Number of Discounted Parts Showing in Locates: The total number of discounted parts (not unique) from your dealership that have appeared in other dealer's Locator search results. Note: This data is not available for any date before March 1, 2017.
Don't see anything here? Click here to learn how to learn how to discount parts on the Locator.
MarketplaceDirect
Monthly Sales $: The total sales $ trend for MarketplaceDirect orders. (This is for all orders except those with a Status of Cancelled.)
Orders: The trend for your dealership's MarketplaceDirect orders. (This is for all orders except those with a Status of Cancelled.)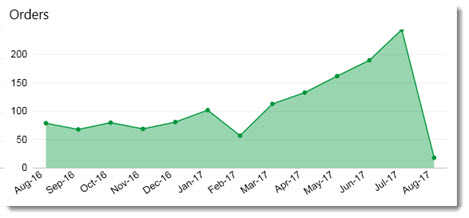
Top 10 Selling Parts: A breakdown of the parts sold (by part number) by your dealership through MarketplaceDirect.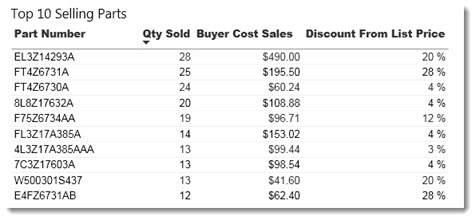
|
Field Name |
Definition |
|
Part Number |
The part number ordered from your dealership. |
|
Qty Sold |
The total number sold. |
|
Buyer Cost Sales |
The total dollar sales for the part through MarketplaceDirect. |
|
Discount From List Price |
The average discount (from List Price) for the part. Formula: (Total MSRP - Total $ Buyer Cost)/(Total $ MSRP) = Discount from List Price. |