KB Article #4451
LinkIQ allows you to view, sort, and drill into DMS information--allowing you to analyze your business performance and the benefits of your OEC subscription(s). Note: The DMS Dashboard is only available to dealers that provide DMS data to OEC as part of their LinkIQ subscription. Get started with LinkIQ. Dealers provide DMS data by completing the process found here.
To view your DMS Dashboard:
- Click the LinkIQ tab.
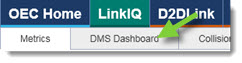
- Click the DMS Dashboard tab.
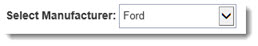
- Information is displayed by OEM. If your dealership services multiple manufacturers, use the Select Manufacturer drop-down to switch.
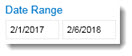
- Select your preferred Date Range. (By default, all available data--13 months--will display.)
- If desired, use the following drop-downs to narrow the information displayed:
- Sales Person: This drop-down will not affect the Sales Mix graph.
- Account Number: This can be the "billing" account number associated with a customer or customer's transaction type (warranty, collision parts, mechanical parts, mechanical parts wholesale, internal body shop). This drop-down will not affect the Sales Mix graph.
- State or Province
- City
- Customer Name
- Sale Type
- The reports will automatically update based on the selections made. Click the Clear Selections (
 ) button to reset the drop-down. (This will display when you move your mouse over the data field.)
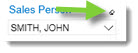
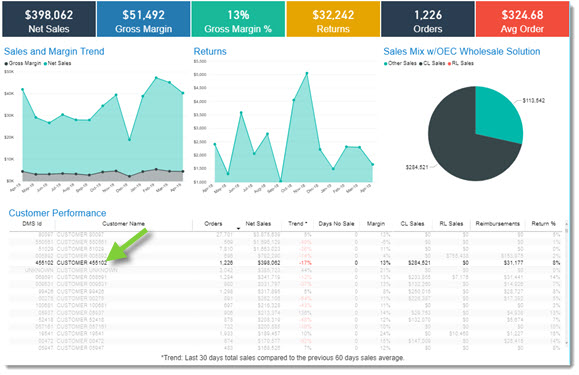
- PSXLink/LinkIQ will display the following high level details of your business:

- Net Sales: Total net part sales. Note: This is the total from your DMS.
- Gross Margin: Total net part sales minus total dealer cost sales.
- Gross Margin %: The Gross Margin (total net part sales minus total dealer cost sales) divided by your Sales (total net part sales) and shown as a percentage.
- Returns: The total dollar value of parts returned.
- Orders: The total number of invoices completed.
- Avg Order: The average order dollar amount (net part sales) of orders completed. (Sales divided by Orders)
- Beneath that, the following reports will display:
- Sales and Margin Trend: Net Sales (total sales) and Gross Margin (total gross profit dollar margin) trend by year, month (default level), or day. Note: Net Sales is in light blue, Gross Margin is in dark blue.

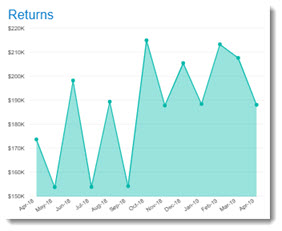
- Returns: The returned-parts dollar amount by year, month (default level), or day.
- Sales Mix w/OEC Wholesale Solution: Your sales volume breakdown by CollisionLink sales, RepairLink sales, and sales that cannot be tied to those OEC solutions.

- Customer Performance: Details each customer's interaction with your dealership, including:
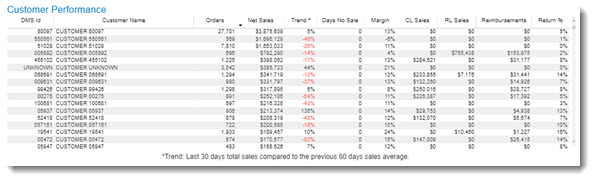
- DMS Id: The DMS number for the customer.
- Customer Name: The customer name from the DMS data.
- Orders: The total number of completed invoices/orders for the customer.
- Net Sales: The total net dollar part sales for the customer.
- Trend: Your total sales for the last 30 days compared to the previous 60-day sales average. Note: Numbers in red indicate sales were below that average.
- Days No Sale: The number of days since the customer placed an order with your dealership.
- Margin: The customer's total net part sales minus the total dealer cost for the parts.
- CL Sales: The total (net) CollisionLink dollar sales for the customer.
- RL Sales: The total (net) RepairLink dollar sales for the customer.
- Reimbursements: The total CollisionLink and RepairLink reimbursement dollars for orders by the customer.
- Return %: The total dollar value of parts returned by the customer divided by the total dollar value of the parts sold to the customer.
- Sales and Margin Trend: Net Sales (total sales) and Gross Margin (total gross profit dollar margin) trend by year, month (default level), or day. Note: Net Sales is in light blue, Gross Margin is in dark blue.
- Additionally you can use the graph options to:
- Drill deeper (
 ) or view higher levels (
 ) of a graph--when available.
 - Hover over a data point to view its details.

- Click on a customer within the Customer Performance report will display that customer's information in the graphs. (Click the customer name again to view all customer data.)
- Click the Focus mode (
 ) button to enlarge a specific graph. (Click Back to Report to redisplay all graphs.)
 - Click the More options (
 ) button to:
- Change the sort option for a graph.
- Export (Export data) the summarized (data that displays in the graph) or underlying data into Excel or CSV format. (Underlying data can only be exported in Excel format.)
- View the data breakdown (Show Data) for the graph.
- Spotlight a single graph on the window.
- Drill deeper (