KB Article #4457
Use the CollisionLink Dashboard to analyze your performance regarding parts and conversion sales, OEM program margins, and which shops do the most volume with your dealership. Note: The CollisionLink Dashboard is only available to dealers that have a current CollisionLink subscription.
To view your CollisionLink Dashboard:
- From the PSXLink tab, choose CollisionLink from the Dashboards drop-down menu.
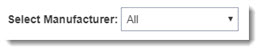
- By default, the Select Manufacturer box displays all manufacturers. If your dealerships supports multiple OEs use the Select Manufacturer drop-down to filter your display to a single OEM.
- If desired, use the following drop-downs to narrow the information displayed:
- Date: By default, all available data--13 months--will display.
- Transaction Type: If your dealership has PartsTrader integration, use this option to narrow your results down to only CollisionLink or PartsTrader transactions.
- Sales Person: Select individual or multiple salespeople from the list.
- State or Province: Select individual or multiple locations from the list.
- City: Select individual or multiple locations from the list.
- Shop Name: Select individual or multiple locations from the list.
- The reports will automatically update based on the selections made. Click the Clear Selections (
) button to reset the drop-down. (This will display when you move your mouse over the data field.)
- PSXLink will display the following high level details of your business:
- CollisionLink Sales: Total dollar value of all CollisionLink sales.
- Completed Orders: Total number of completed (Submit/Commit button clicked) CollisionLink orders.
- Reimbursement: Total dollar value of OEM reimbursements received for CollisionLink orders.
- Conversions: The percentage of the total parts converted divided by the total number of conversion opportunities received.
- Missed Opportunities: The total dealer cost for all conversion part opportunities that were not converted to OE parts orders.
- Beneath that, the following reports will display:
- Sales Trend: The total CollisionLink sales trend by year, month (default level), or day--separated by Conversion Part Sales (parts sent as Upsell Opportunities that were converted to OE parts) and OE Specified Part Sales (parts requested and sold as OE).
- Program Reimbursement: The total dollar amount of seller reimbursements from the manufacturer, viewable by year, month (default level), or day.
- Opportunities vs Conversions: Displays the dollar value of the conversion opportunities (Opportunities) sent to your dealer compared to dollar value of parts converted to OE (Conversion Part Sales).
Move your mouse over the graph to measure your PMA program conversions, sales and performance for a specific time frame. - Transacting Shops: The number of unique shops that transacted with your dealership by year, month (default level), or day.
- Shop Performance: Details each customer's interaction with your dealership, including:
- Shop Name: The shop name.
- Completed Orders: The total number of completed orders for the shop.
- CL Sales: The total net dollar part sales for the shop.
- Trend: The last 30 days total sales compared to the previous 60 days sales average. (Numbers in red indicate sales were below that average.) TIP: Use this column to identify and contact shops with negative trends to understand why they've stopped buying from your dealership.
- Conversions: The percentage of the total parts converted divided by the total conversion opportunities received.
- Profit w/ Reimb.: The total (net) CollisionLink dollar sales for the customer.
- Margin %: The total dollar value of parts returned by the customer divided by the total dollar value of the parts sold to the customer.
- Sales Trend: The total CollisionLink sales trend by year, month (default level), or day--separated by Conversion Part Sales (parts sent as Upsell Opportunities that were converted to OE parts) and OE Specified Part Sales (parts requested and sold as OE).
- Additionally you can use the graph options to:
- Drill deeper (
) or view higher levels (
) of a graph--when available.
- Hover over a data point to view it details.
- Click on a customer within the Shop Performance report will display that customer's information in the graphs. (Click the customer name again to view all customer data.)
- Click the Focus mode (
) button to enlarge a specific graph. (Click Back to Report to redisplay all graphs.)
- Click the More options (
) button to:
- Change the sort option for a graph.
- Export (Export data) the summarized (data that displays in the graph) or underlying data into Excel or CSV format. (Underlying data can only be exported in Excel format.)
- View the data breakdown (Show Data) for the graph.
- Spotlight a single graph on the window.
- Drill deeper (